“Section Four - Gait Analysis Systems” from Gait Analysis: Normal and Pathological Function1
Basically, there are 5 measurement systems.
Three of these focus on the specific events that constitute the act of walking.
行走各个阶段
- Motion analysis defines the magnitude and timing of individual joint action.
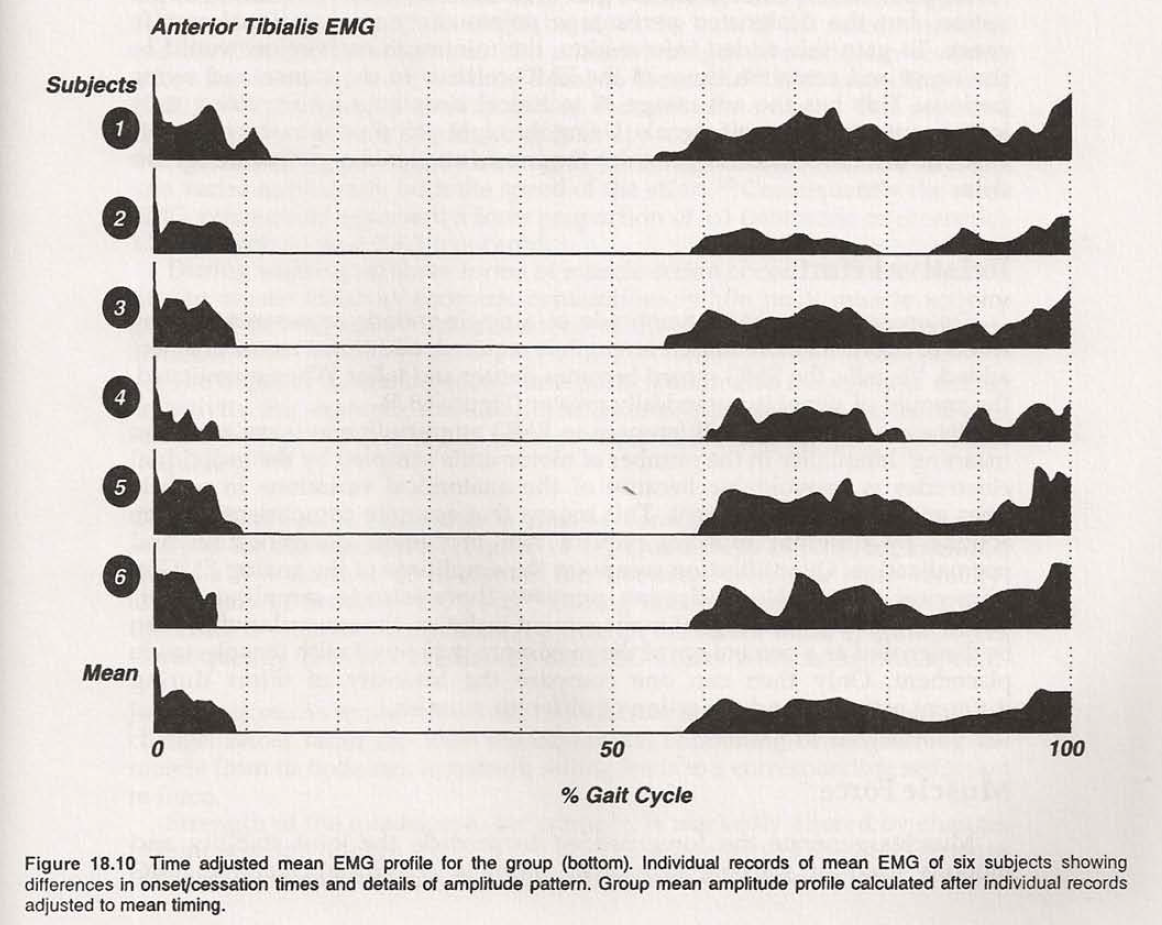
- Dynamic electromyography identifies the period and relative intensity of muscle function.
- Force plate recordings display the functional demands being experienced during the weight-bearing period.
The two remaining gait analysis technics summarize the effects of the person’s gait mechanics.
行走整体效果
- overall walking capability, one measures the patient’s stride characteristics
- efficiency revealed by energy cost
Motion analysis 运动分析
Problems: the technical challenge of making the necessary measurements; the effect of out-of-plane movement on the amount of sagittal motion that is perceived.—>placing a goniometer(测角仪) on the limb and using three-dimensional camera recording
获取数据$\rightarrow$标注关节
中立位确定(根据解剖学by the American Academy of Orthopaedic Surgeons)以及关节骨骼旋转方向正负的定义见原书1p374
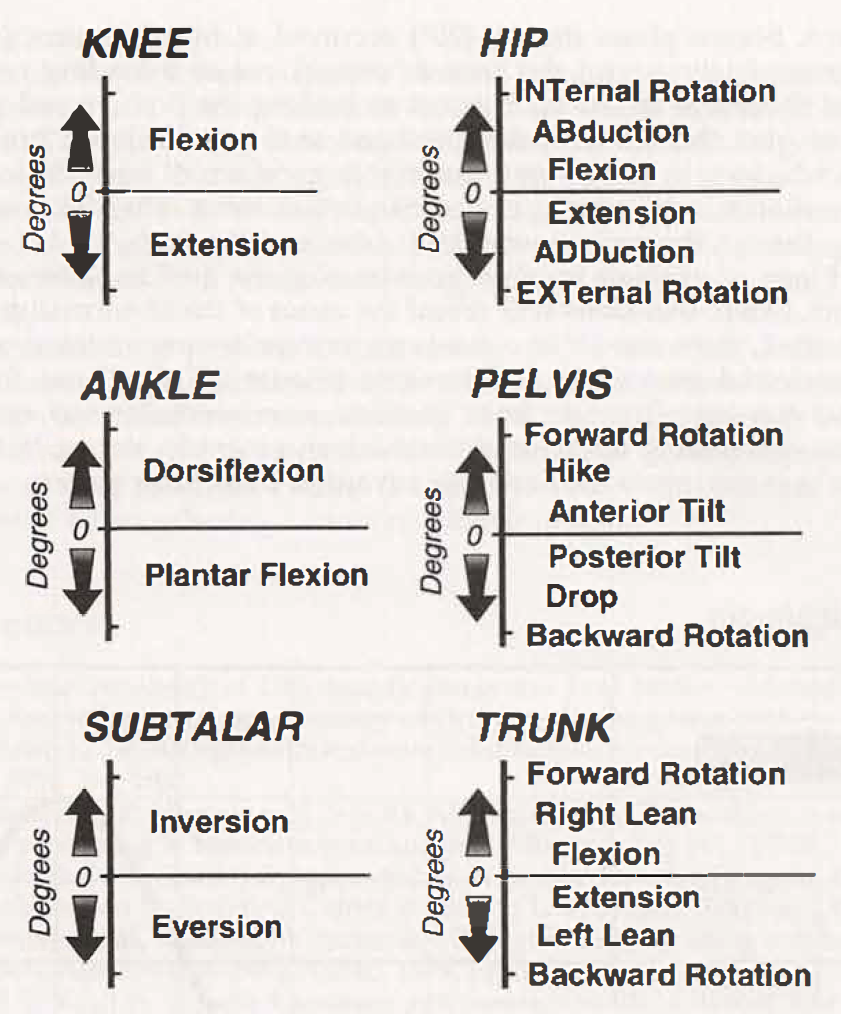
Reference scales. The direction for graphing each motion of the individual joint is identified. “0” represents the neutral position for the motion. Vertical axis indicates magnitude of motion. Arrow denotes increasing values for each direction. Horizontal axis represents the gait cycle time scale.
Motion Data Interpretation
The minimum information available from a motion record is the magnitude of the peak angles (high and low) experienced by the joint being studied.
通过峰值划分motion,和正常状态下相比较(1️⃣magnitudes of joint motion 2️⃣ timing of the action 3️⃣ coordinating the motion patterns of the adjacent joints)
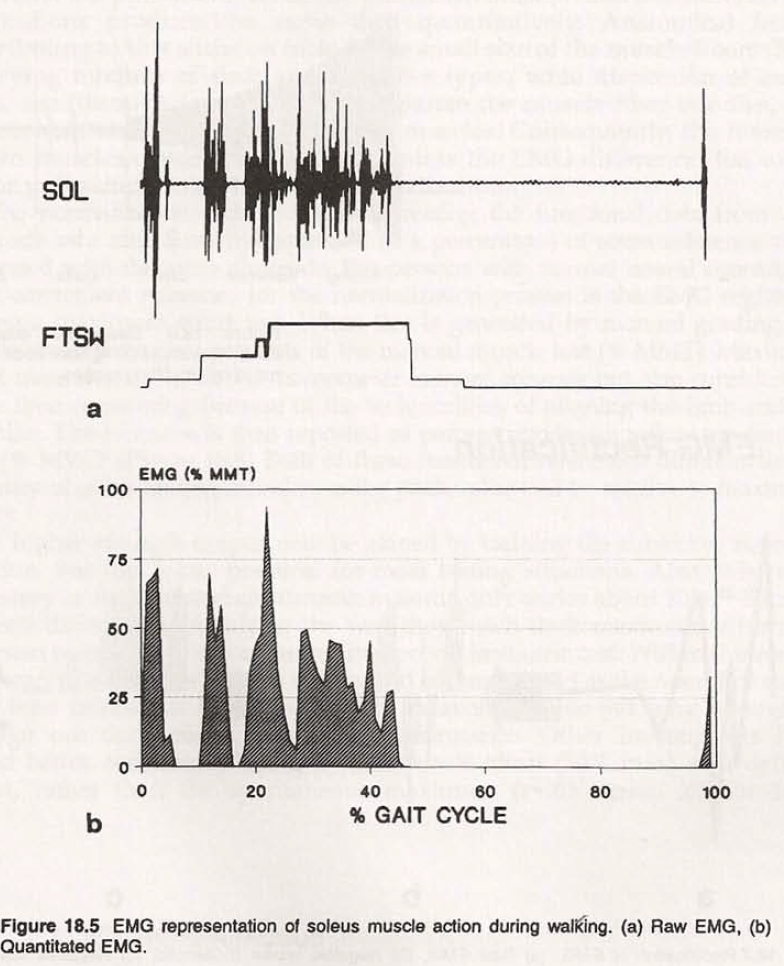
Dynamic Electromyography 肌肉控制与动态肌电图
EMG Quantification 肌电图量化
Manual (or descriptive); Electronic summation of the EMG signals; Computer quantification
采样频率2500Hz 但数据过多,一般取1000或500Hz
数字化,对信号进行全波整流(避免正负值在后续处理中相互抵消。整流包括将所有的负信号转置到零线的正侧)
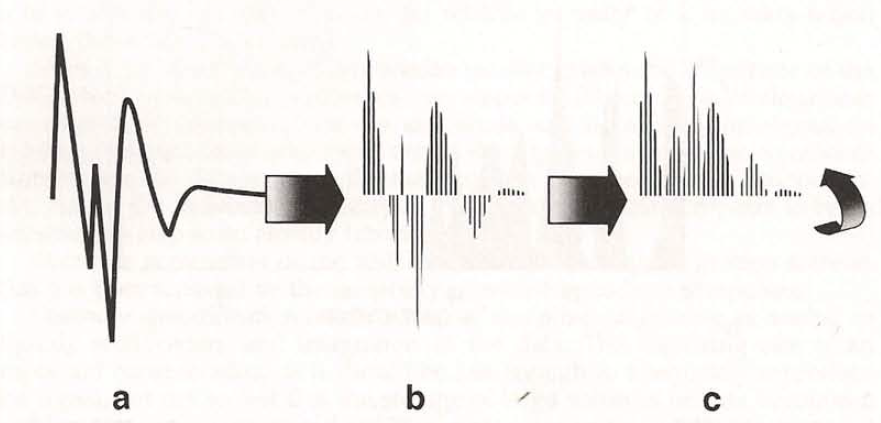
在一个适合的时间间隔进行累加;0.01秒interval(大约1% GC)被发现是最好的;3% interval: less variability in the EMG wave
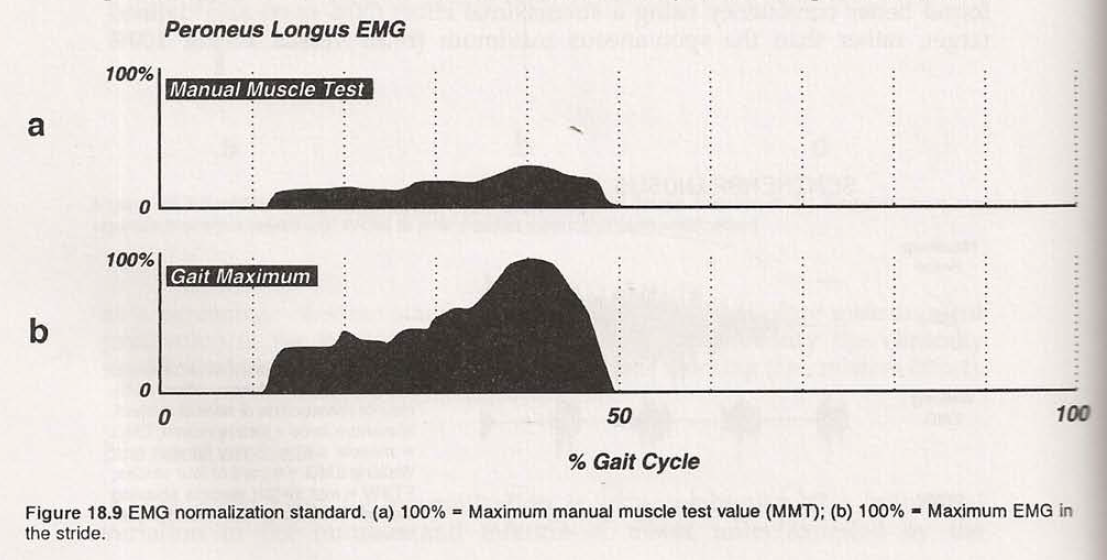
归一化技术:将每个电极的功能数据作为参考值将同一电极产生的值转化为比率(通常以百分比表示)。
adjusting the onset and cessation times of the individual quantified records to match the mean timing.
EMG Interpretation
timing与运动相 phases有关 用于判断当前运动状态
Relative Effort 运动越用力,振幅变大,图形密集
EMG和force相互推导
Ground Reaction Force and Vector Analysis 步态动力学——地反力、向量、力矩、功率和压力
ground reaction forces (GRF)
Vertical Load
Characteristics
Normal stance phase pattern of vertical forces generated by the customary walking speed of 82m/ min has two peaks separated by a valley.
The force on the force plate changes with changing vertical acceleration.
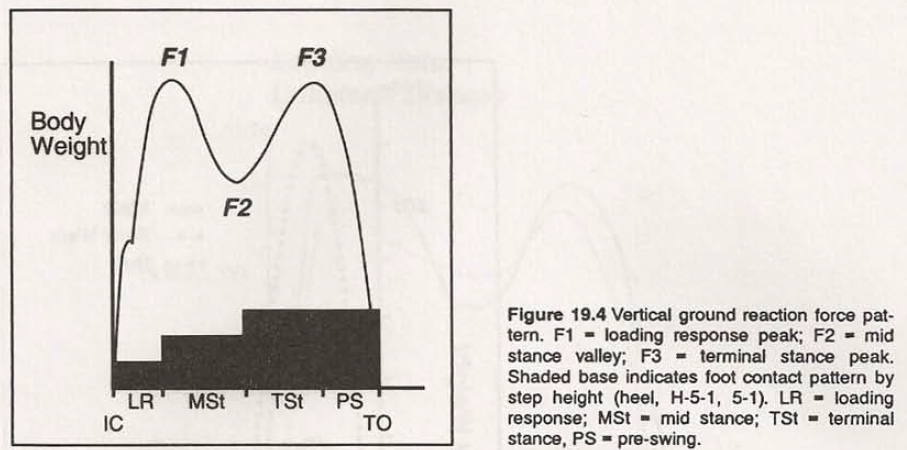
峰值值约为体重的110%,而谷值力约为体重的80%。第一个峰(F1)发生在MS的开始,此时身体的重心正在迅速下降。在MS后期,谷值(F2)是由身体向前滚过静止的脚时重心上升造成的。第二个峰值(F3)出现在TS后期,再次表明身体重心向前落在TS的前足上时重心下降。
Vertical force & Speed
v减小,峰谷更平坦,反之亦然。
The magnitude of the vertical force changes with variations in gait speed. Walking at slower speeds (<60m/min) reduces the momentum, and therefore the vertical acceleration, with a corresponding decrease in both the peaks and valley deviations from body weight.
Conversely, fast walking speeds induce higher peaks and lower valleys. Running registers peaks 2.5 times body weight.
Horizontal Shear
The forces generated parallel to the wa1king surface are called shear.
Horizontal forces in the anterior-posterior (AP) plane: the ground reaction force vector deviates from the vertical.
Horizontal medial-lateral (ML 内侧 外侧 ) shear forces: the exchange of body weight from one limb to the
ML force is least, being less than 10% of body weight. Peak medial shear (5% BW) occurs in mid loading response. Lateral shear reaches a peak (7% BW) in terminal stance.
The AP shear force (also called fore-aft forces) is equivalent to less than 25%of body weight. At initial contact there often is a momentary aft shear (13% BW).
Loading the limb rapidly introduces an anteriorly directed force, which reaches a peak (13% BW) at the end of the loading response phase. This is not sustained.
Mid stance is an interval with minimal sagittal shear until just before heel rise, when a posterior shear begins. There is a rapid rise in the posterior force throughout terminal stance, with a final peak equaling 23%BW.
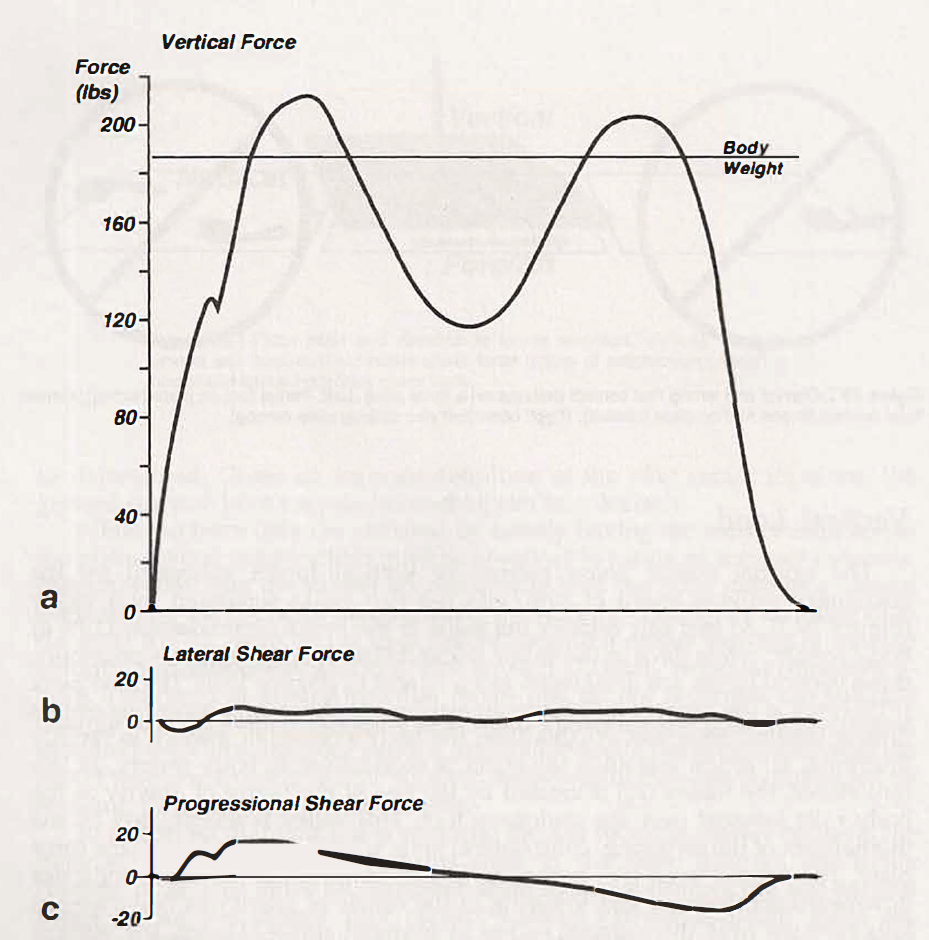
⬆️ Normal ground reaction force pattern during stance. (a) Vertical force; (b) Lateral shear (horizontal); (c) Progressional shear (horizontal fore/aft).
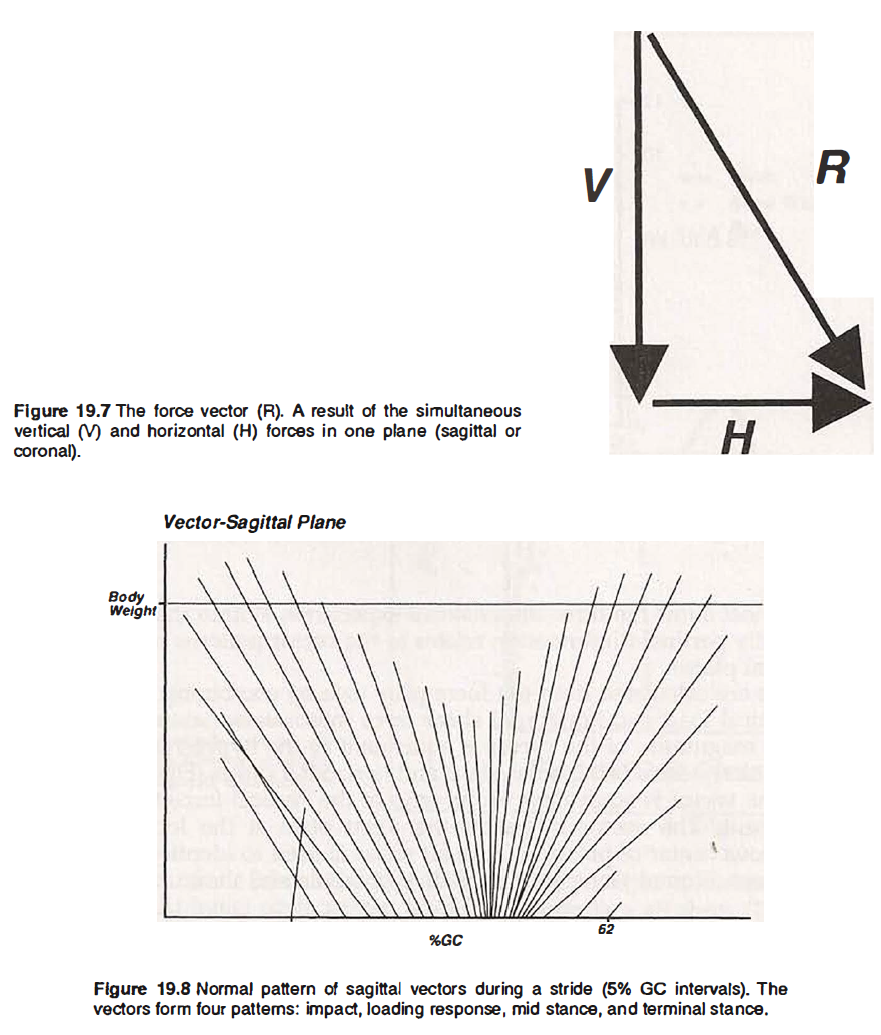
Vectors
Joint Torques
Torque is defined as the product of the force and its lever arm T = FxL. The lever (or moment arm) for the joint torque presented by the body’s posture is the perpendicular distance between the line of action of the vector and the center of the joint. The vertical ground reaction is the determining force in stance. By combining motion and vector data the torques occurring throughout the stride can be calculated. Sagittal plane data define the flexion and extension torques. Coronal plane measurements identify the abduction and adduction demands. Transverse moments (torques) are calculated by combining the fore-aft and mediolateral values. Calculation of joint torques from the vector and motion data, as just described, is technically easier, but the effects of gravity and inertia are not included. Studies comparing moment calculations with and without considering the gravitational and inertial factors have shown no difference in the ankle data, but at the hip and knee there were intervals in the gait cycle where the simple vector data registered higher values The investigators have differed on the significance of these findings. Bressler and Frankel noted a brief increase in both the knee and hip values at the beginning loading response of approximately 20% and a similar difference in terminal stance for the hip. Mikosz et al noted the exaggeration of the sagittal knee and hip torques (expressed in units of percent body weight X stature) was 1 % each. These two groups of authors concluded that for most situations, use of the unmodified vector data was adequate. Wells , in contrast, felt the omission of the While very significant for understanding the logic of muscular action, the resulting numbers tend to be too abstract for most clinicians.
自重会带来影响但部分研究人员认为可以忽略。
Center of Pressure C/P
base of the GRF vector lies within the foot, as that is the body segment in contact with the floor.
While the word pressure is in common use, it is not correct, as the area of contact is not considered in the calculation. Center of support would be more accurate.
Each C/P point represents the mean of the vertical forces on the four instrumented supporting posts of the force plate. By also defining the location of the foot on the force plate, an anatomical correlation can be made. The center of pressure is related to the plantar outline of the foot, but its location does not necessarily identify that portion of the foot receiving the greatest pressure. Only during the period of isolated heel support in loading response or the forefoot support interval in terminal stance will the C/P have any anatomical significance. Even then, the C/ P point represents an average of all the forces on either the heel or forefoot, not the site of maximum pressure.
The C/P is located in an anatomical area that makes little or no contact with the floor. C/P位于一个解剖区域,很少或没有接触地板。
Intrinsic Foot Pressure
To determine the pressures experienced by the different structures within the foot
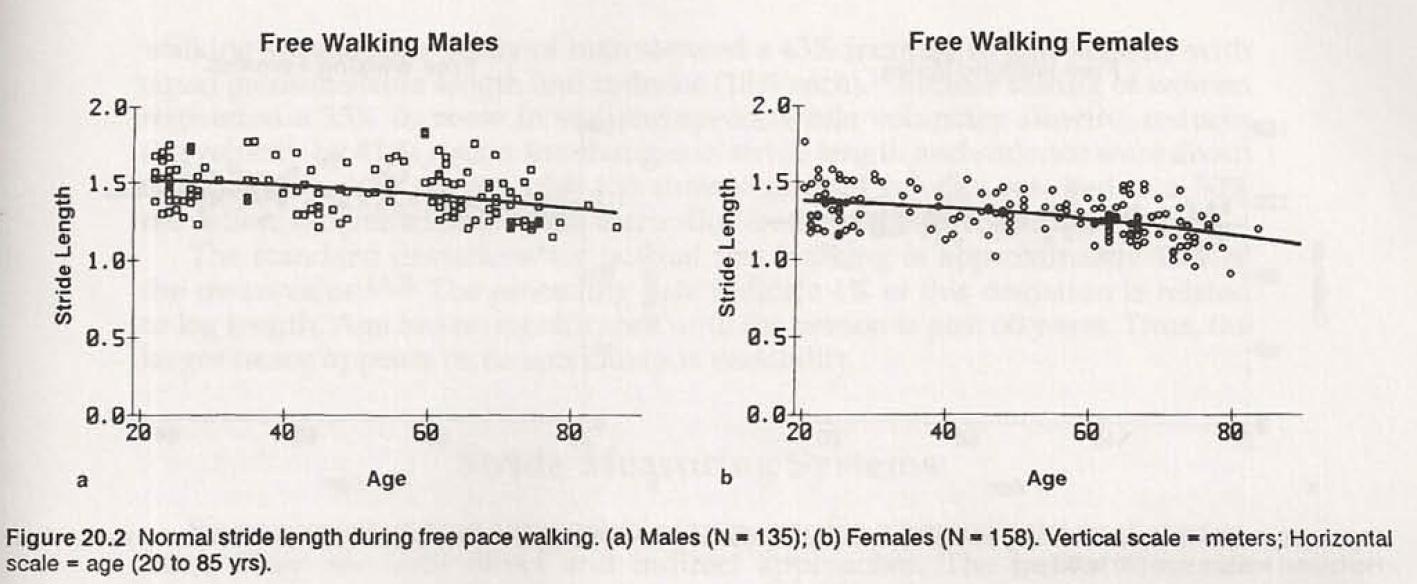
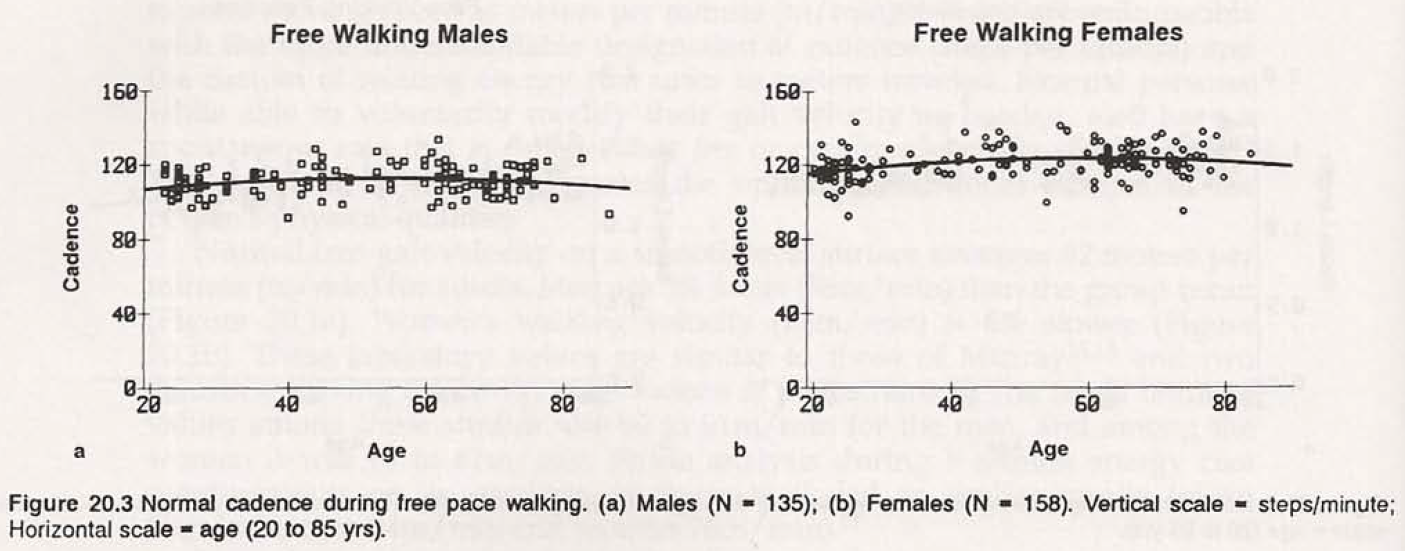
Stride Characteristics 步幅分析
The natural mix of joint mobility, muscle strength, neural control and energy leads to a customary walking speed, stride length and step rate. These time and distance factors, in combination with the swing and stance times, constitute the person’s stride characteristics.
Normal persons, while able to voluntarily modify their gait velocity as needed, also have a spontaneous rate that is called either free or customary walking speed (CWS). This free rate of travel designates the optimum functional balance of the person’s physical qualities.
Velocity = Stride Length x 0.5 Cadence Cadence (step rate)
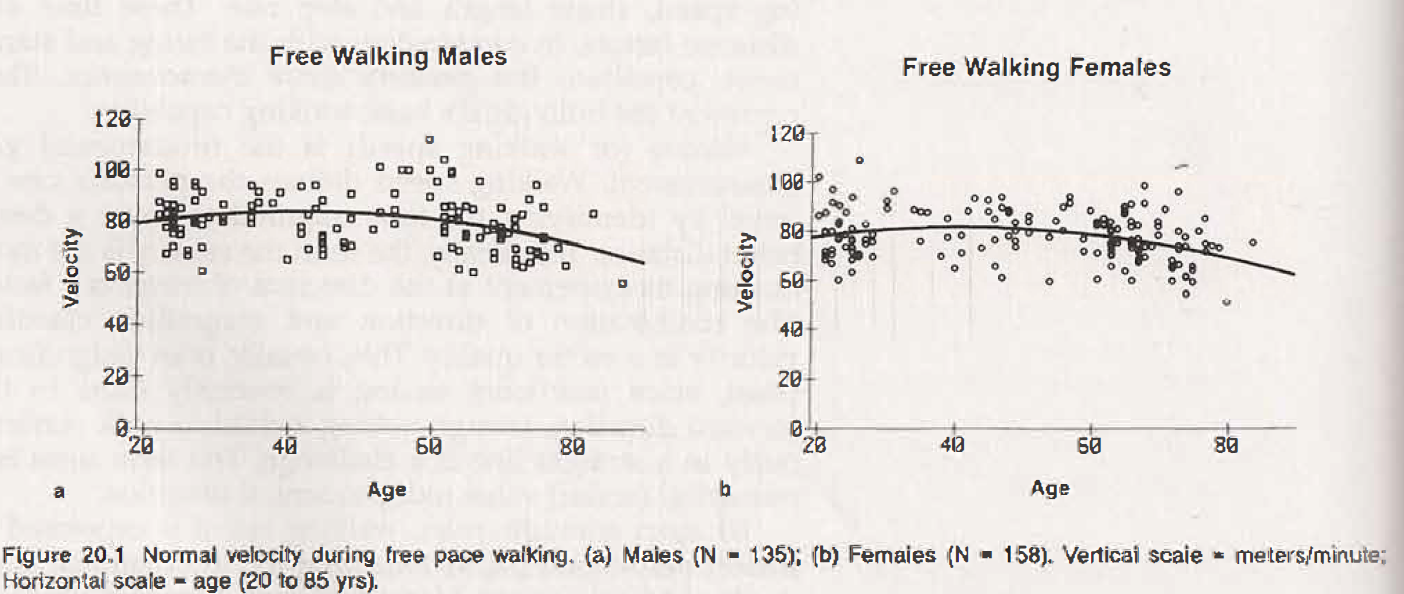
Normal Variability
Normal adults show a moderate variability in their free walking velocity. One group of 60 subjects ages 20 to 65 years showed a 7% standard deviation during indoor testing following pretraining to a common cadence. Another 111 persons ages 20 to 80 tested on an outdoor track displayed a 4% deviation. Two identifiable sources of this variability are age and height (or limb length). Age
- A notable difference in velocity (14%) when arthritis and other disabilities are allowed as natural events.
- With healthy subjects the influence of age is less, but increases as years beyond 65 are added.
- The decrease in mean velocity was just 3% for a 60- to 65-year-old group. This increased to 9% when the study group included ages 60 to 80; significant decline in walking ability began after age 70 years.
Limb Length 儿童中显著;成人腿长与步幅相关性不强($r^2$ = 0.21 ~ 0.28)
Voluntary Variability
Normal persons have a wide range of safe and relatively comfortable walking speeds.
the changes in stride length and cadence were about equal. (of similar percentage)
The standard deviations for normal free walking is approximately 10% of the mean value. The preceding data indicate 4% of this deviation is related to leg length. Age has no significance until the person is past 60 years. Thus, the larger factor appears to be spontaneous variability.
Energy Cost 能量消耗
与实验无关,暂略
-
J. Perry, J.M. Burnfield Gait Analysis: Normal and Pathological Function(2nd ed.), SLACK Incorporated (2010) ↩︎