The effect of stride length on lower extremity joint kinetics at various gait speeds
- Research question
- Concepts
- Notations
- Background
- Materials and Methods
- Results
- Conclusion
- Limits/Further Work
- Thoughts/Comments
Research question
In this study, we investigated how sagittal plane joint moments are affected by a factorial modulation of two important gait parameters: gait speed and stride length.
We designed an experimental study to establish the effects of GS and SL on the resulting hip, knee, and ankle joint moments. The findings are intended to inform the design of a robotic controller that delivers pulses of torque to the lower extremity joints with optimal timing and amplitude to induce desirable modulations of GS and SL, and of associated spatiotemporal parameters.
Concepts
sagittal plane矢状面,把身体分成左右两条,解剖学用来描述身体各部分位置(类似经线)N.B.不只有中线
sagittal plane movement包括任何具有前后成分的运动
Notations
-
GS: gait speed
-
TLA: trailing limb angle
-
SL: stride length
-
SL for cycle k was defined based on the right heel strike time t and anteroposterior coordinate in the laboratory frame x and constant velocity of the treadmill v
$SL_{(k)}=x_{(k+1)}-x_{(k)}+v(t_{(k+1)}-t_{(k)})$
-
-
$L_l$: leg length in m
-
$\alpha_l$: time of application(defined as the set of integers between 5% and 95%, providing a quantization in the time of application of torque pulses equal to 1% of a gait cycle duration)
-
$A_l$: amplitude
-
$\tau(\overset{\sim}t)$ : an average hip, knee, and ankle joint moment profile(力矩); Segmented gait cycles linearly resampled in the [0, 100] % gait cycle domain $\overset{\sim}t$ and averaged at each point in gait cycle to yield $\tau(\overset{\sim}t)$
-
$\overset{\sim}\tau$/$\overset{-}\tau$: normalized joint moments.
Background
-
gait training devices
-
that promote desired changes in gait
-
Challenges in developing such devices: limited understanding of human response to robotic input
- 比如机器人运动辅助会怎样影响gait speed
-
Possible method of controller formulation: control robot to apply the change in joint moment applied by human subjects when they achieve a gait feature of interest.
-
However, it is currently unclear how lower extremity joint moments are modulated by even basic gait spatio-temporal parameters.
-
-
GS $\leftrightarrow$ propulsive force + Propulsive impulse $\leftrightarrow$ TLA $\Rightarrow$ GS $\leftrightarrow$ TLA
GS correlated with anterior- posterior ground reaction force(the propulsive force of the foot against the ground)1
Propulsive impulse冲量(the propulsive force integrated over time), is associated with the posture of the trailing limb at push-off.2 The posture of the trailing limb at push-off is quantified by one kinematic parameter, known as trailing limb angle (TLA), defined as the angle of the line connecting the hip joint center and foot center of pressure at the instant of peak propulsive force, relative to the global vertical axis最大推进力瞬时髋与足中心连线与竖直方向的夹角
When increasing GS, the increase in TLA contributes twice as much as the increase in ankle moment to the resulting increase in propulsive force. In older adults exposed to a biofeedback paradigm for increasing propulsive force, increased TLA and decreased hip flexor power were the primary means by which they increased propulsive force.
-
A possible method of controller formulation can be derived from the principle of bio-inspiration, where a robot is controlled to apply the difference in joint moment applied by human subjects when they achieve a desired gait feature (in this case modulation of TLA), relative to their normal walking condition. 控制思路:检测TLA变化,根据正常行走时的关系调整辅助系统的关节运动
-
Since TLA has not been a primary measure ofinterest in the biome- chanics literature, we extended our search to a more common variable, likely correlated to TLA, such as stride length (SL).
-
GS modulation和magnitude of peak joint moments的关系研究得比较多,hip knee ankle和变化的先后关系、出现的phase等;However, fewer investigations have focused on the joint kinetics associated with the modulation of spatiotemporal parameters such as SL or TLA, and studied this effect at multiple GS values.又列举了一些证明SL和关节动力学有关的研究;Thus far, the factorial modulation ofboth GS and SL and resulting hip, knee, and ankle kinetics has not been investigated; as such it is unclear how lower extremity joint moments are modulated by both gait parameters.
Materials and Methods
- 准备:跑步机;36 reflective spherical markers (4 on the pelvis, 4 per thigh, 4 per shank, 2 per knee, and 6 on ankle/foot;摄像头动捕;Marker data were acquired at 100 Hz, while the treadmill analog force/torque data were acquired at 2 kHz;biofeedback 显示当前SL使被试进行调整
- 采样(GS 5 * SL 3 = 15种场景):1️⃣ calculate the subject’s self-selected gait speed (ss-GS) 2️⃣ Non-biofeedback conditions: calculate ss-SL at five speeds (ss-GS [80%, 90%, 100%, 110%, 120%] in random order) 3️⃣ Biofeedback conditions: 被试根据跑步机的SL反馈分别用 1+17% / 1-17% 的ss-SL
- 数据分析
Data analysis
1. 数据处理
1️⃣ 25N门控处理力 2️⃣ 低通滤波处理动捕和力(cut-off currency分别6Hz 30Hz)3️⃣ 插值处理动捕数据(a third order polynomial fit for a maximum gap size of five samples三阶多项式拟合)4️⃣ 将受试者的质量、身高和站立校准标记位置应用到解剖模板中,得到一个7节段(骨盆、大腿、小腿和脚)受试者模型
(a) In a custom MATLAB (MathWorks, Natick, MA, USA) script, hip, knee, and ankle joint angles and moments for the right leg in the sagittal plane were extracted and filtered with a 2nd order low-pass zero-shift Butterworth filter with a cut-off frequency of 15 Hz.
(b) Gait cycles were segmented between subsequent heel strike events, defined as the instants at which the vertical ground reaction force changed in value from zero to positive, and remained positive for a minimum of 400ms. 手动检查排除由于仪器故障/被试踏空导致的异常数据; A minimum of 25 segmented gait cycles were linearly resampled in the [0, 100] % gait cycle domain $\overset{\sim}t$ and averaged at each point in gait cycle to yield an average hip, knee, and ankle joint moment profile $\tau(\overset{\sim}t)$ for each of the 15 experimental conditions for each of the 20 subjects
(c) the non-dimensional无量纲 joint moment $\overset{\sim}\tau$ was calculated for each joint as $\overset{\sim}\tau(\overset{\sim}t)=\frac{\tau(\overset{-}t)}{WL_l}$ , where W is body weight in N, and $L_l$ leg length in m, measured as the distance between the hip joint center and the floor during straight-leg standing.
2. Protocol validation
总结:
- 用$CV_{Fr}$ 证明不同被试之间动力学相似性;
- 计算不同GS下用腿长规范化的步长方差(比较小,同一个GS下的SL是比较稳定的);
- 线性回归得到r值证明$TLA$和$SL_0$统计学意义上相关;
- 基于12证明实验计划可以显著改变SL和GS,所以可以进行统计学分析
(a) a non-dimensional GS(Froude number) $F_r=GS/\sqrt{L_lg}$ used as an index of across-subject dynamic similarity in ss-GS3: a smaller variance of Froude numbers within a group of individuals should reflect consistent gait kinetics. $\rightarrow$ the coefficient of variation $CV_{Fr}$
(b) $CV_{Fr}=\frac { \sigma _{Fr}}{\mu_{Fr}}$ corresponding to the ss-GS condition$\rightarrow$ compared it to alternative indices, $CV_{ss-GS}$ using $ss-GS$ ; $CV_{ss-GS_0}$ using $ss-GS_0$ normalized by leg length; $\Rightarrow$ 用于量化across-subject variability (c) calculate SL using this Eq
(d) TLA 根据定义
(e) To determine if the imposed biofeedback effectively modulated SL in healthy subjects, 计算15种情况的distribution of SL values, the mean $TLA$ and $SL_0$ $\rightarrow$ conducted a linear correlation analysis using these two measurements as factors to assess the statistical association between normalized stride length and TLA.
3. Continuum analysis
总结:时序信息分析
- 关节力矩时序信息与GS, SL, interaction GS-SL相关性分析(repeated-measure 2-way ANOVA两因素重复测量方差分析;另一因素是时间),得到GS SL在一个步态周期内与哪些关节运动相关、相关性强度等
- 给定关节、GS,对ss-SL vs +17%和ss-SL vs -17%比较组下的关节力矩时序信息进行双侧配对t检验
main effect analysis
(a) repeated-measure 2-way ANOVA on the mean joint moment profiles measured from each subject and experimental conditions, spanning exhaustively the 15 combinations of factors.
ANOVA was conducted to test the null hypothesis(零假设/原假设 一般是希望证明其错误的假设) that neither factor (GS and SL), nor their interaction, induce a significant effect on joint moment at any time point.
(b) the dependent variable $\overset{\sim}\tau(\overset{\sim}t)$ one-dimensional (1D) smoothed time series including highly temporally correlated data, and not a zero-dimensional scalar quantity $\rightarrow$ confidence intervals置信区间的定义和false positive rates (FPR)的控制需要correction4 (for multiple comparisons that accounts for the temporal correlations in the input time series) $\rightarrow$ SPM1D software package
SL
the null hypothesis: the mean profiles measured at the same speed for nominal and bio-feedback modulated SL conditions were not different from one another at any time point.
two comparisons (ss vs. increased SL, and ss vs. decreased SL) per speed, per joint, for a total of $n_{comp} $= 30 pairwise comparisons.
Pairwise comparisons: two-tailed paired t-tests and defining thresholds t-scores for significance at α = 0.05 using a Bonferroni correction ($n = n_{comp}$) on the paired difference thresholds calculated by SPM1D.
4. Torque pulse approximation
to approximate the effect of SL modulation on joint moment profiles with a series of rectangular pulses of torque. 用矩形脉冲的叠加拟合SL调整对关节运动的影响
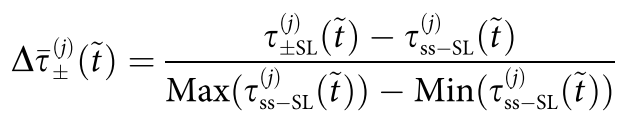
(a) the normalized difference $\Delta \overset{-}\tau(\overset{\sim}t)$ of subject specific average joint moment profiles $\tau(\overset{\sim}t)$ between conditions of positive or negative SL, and ss SL, at each gait speed $j$ :
(b) rectangular torque pulses $P_{\pm}(\overset{\sim}t)$
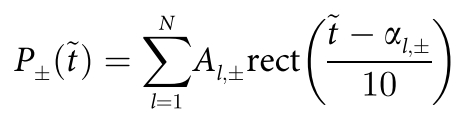
这个工作中$N=1,2$(即进行两种脉冲近似); 非线性规划求出$a_l,A_l$ ($min$ 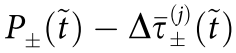 ),根据$A_l$(矩形脉冲的振幅)正/负方向分成两组
(c) to identify pulse magnitude and location
统计学分析joint, direction of SL modulation, and sign of applied pulse是否significantly modulate pulse magnitude(absolute value of pulse amplitude) and location $\leftarrow$ 独立的线性混合效应模型SAS V9.4, SAS Institute, Cary, NC(包括每个因变量独立带来的effect/两个之间/三者相互带来的effect)
Heterogeneity due to trials completed under different gait speed conditions, and multiple pulses in the case of the two pulse approximation were accounted for by the inclusion of random effects. Correlation between multiple measurements taken on the same subject were accounted for by the inclusion of a repeated measure effect. Upon comparing nested model Akaike information criterion (AIC) values, the lowest AIC value came from the unstructured covariance structure and was therefore selected for the final models.
(d) 若证明了(c)统计学显著性($\alpha<0.05$),进一步 post hoc Tukey-Kramer tests ($\alpha=0.05$)
1️⃣ for the joint and SL modulation interaction,用于确定在调整SL时关节间pulse magnitude means的显著差异
2️⃣ 图基事后检验法把three-way interaction between joint, SL modulation, and pulse sign分解to find the significant differences between torque pulse location, for a given joint, under different combinations of factors SL modulation and torque pulse sign.
3️⃣ 对于每个关节,比较测量positive pulse torque sign and positive SL modulation的 location variables和negative negative; 比较positive negative和negative positive(找到施加torque pulse的正负与SL调整方向相关的时刻)
(e) 可视化:location histograms;按关节、SL modulation condition分组;(为方便表示,直方图中根据sign of pulse amplitude的正负和magnitude是否大于均值分组)
Results
Protocol validation
(Left) the distribution of mean Froude numbers with 95% confidence intervals at the various treadmill imposed GSs, (center) normalized stride lengths measured at various speeds and biofeedback conditions.
The box plot shows the median as a horizontal line, and the box at 25% and 75% percentiles, with whiskers extending to ±3σ, and (right) mean trailing limb angle and mean normalized stride length for each of the 15 conditions for each of the 20 subjects. Linear regression indicates that there is a strong correlation (r = 0.87) between the two measures.
- The use of the Froude did not reduce the across-subject variability in ss-GS($CV_{ss-GS}=0.104<CV_{Fr}=0.106<CV_{ss-GS_0}=0.121$)All differences account for an effect size that can be considered very small.
- $\sigma_{max}$ of $SL_0$ values for all five non- feedback conditions, averaged across all subjects, was relatively small (3.86%)
- $\Rightarrow$ conclude that the protocol significantly modulated values of SL and GS, such that statistical analysis may be performed.
- linear regression: a strong correlation (r = 0.87) between $SL_0$ and TLA
5GS 3SL 下的$\overset{-}\tau$
Effect of gait speed (GS) and stride length (SL) modulation on the normalized joint moments $\overset{-}\tau$.
Joints are organized by row, GS are organized by columns, relative to the subject-specific ss-GS. Conditions corresponding to cued SL values are superimposed on each plot. Lines indicate the group mean, with the shaded region indicating the standard error.
Continuum analysis
Main effects of gait speed (GS) and stride length (SL), and of their interaction, on the normalized joint moment profiles during normal walking, as described by the 1D time series of F-statistic extracted by the 2-way repeated measure ANOVA.
The threshold F statistic for each experimental condition is reported by the red dashed line, and values above (shaded in green) correspond to a significant group effect of the factor, at the corresponding gait cycle instant, for a corrected type I error rate α < 0.05.
T-statistic resulting from pairwise comparisons of normalized hip(knee, ankle) torque moment at normal and modulated SL (columns), measured at the same GS, for each GS (row).
Red dashed lines show the threshold t value that provides a corrected type I error rate α = 0.05, extracted using a Bonferroni correction that accounts for all pairwise comparisons $n_{comp}$ = 30.
Torque pulse approximation
Histogram of one(two) pulse approximation normalized amplitudes, sorted by SL modulation and joint.
Pulse magnitude by joint and SL modulation for the one(two) pulse approximation (mean ± standard deviation).
Asterisks indicate pairwise comparisons significant at the p < 0.05 corrected level.
Histogram of one(two) pulse approximation locations in gait cycle, sorted by pulse amplitude sign and magnitude.
Magnitude linear mixed effects model results for the one torque pulse approximation.
Magnitude linear mixed effects model results for the two torque pulse approximation.
Magnitude Tukey-Kramer post hoc test results for the one torque pulse approximation.
Magnitude Tukey-Kramer post hoc test results for the two torque pulse approximation.
Location linear mixed effects model results for the one torque pulse approximation.
Location linear mixed effects model results for the two torque pulse approximation.
Location Tukey-Kramer post hoc testing for the one torque pulse approximation.
Location Tukey-Kramer post hoc testing for the two torque pulse approximation.
Conclusion
- gait speed has a significant effect on the moment profiles in all joints considered;
- stride length has more localized effects on the knee moment during stance, and smaller effects observed for the hip joint moment during swing and ankle moment during the loading response.
- TLA Trailing limb angle, a parameter of interest in programs targeting propulsion at push-off, significantly correlated with stride length.
- candidate assistance strategies 不同phase不同关节给相应力矩
Limits/Further Work
- 本工作基于群体分析,在具体应用时需要针对个体
- 本工作基于假设:外骨骼施加辅助力矩时人对行动的贡献不会改变;而事实上人非线性;需要迭代优化
Thoughts/Comments
-
//第一篇完整看完的生物统计的工作,想学习分析流程和思路,所以记得很详细,也花了不少时间。
-
实验对象的描述可参考(健康状态、招募途径、对课题的了解、知情同意书格式、被试统计数据、实验时的衣着情况):
Subjects 20 healthy adults (10 males, 10 females) were recruited to participate in this study (protocol approved by the University of Delaware Institutional Review Board, protocol no. 619724). Subjects—age (mean ± std) 21.55 ± 2.50 yrs, height 1.73 ± 0.08 m, body mass 69.20 ± 8.73 kg— were naive to the purpose of the study, and free of orthopedic or neurological disorders affecting walking function. Subjects were required to wear their own comfortable athletic shoes and lightweight clothing for the walking experiment.
-
数据处理过程可参考
-
统计学
- null hypothesis
- 参数的无量纲处理
- 对包含时间相关性数据的时序信息的处理
- 使用到的函数和模型(repeated-measure 2-way ANOVA, SAS V9.4, SAS Institute, Cary, NC, post hoc Tukey-Kramer tests)
- 对不同步速下实验异质性和同一被试多次测量之间的相关性的说明:Heterogeneity due to trials completed under different gait speed conditions, and multiple pulses in the case of the two pulse approximation were accounted for by the inclusion of random effects. Correlation between multiple measurements taken on the same subject were accounted for by the inclusion of a repeated measure effect. Upon comparing nested model Akaike information criterion (AIC) values, the lowest AIC value came from the unstructured covariance structure and was therefore selected for the final models.
- TODO 注意$F_r=GS/\sqrt{L_lg}$与不同subjects动力学相似性的关系,可以进一步看看参考文献3
-
Bowden MG, Balasubramanian CK, Neptune RR, Kautz SA. Anterior-Posterior Ground Reaction Forces as a Measure of Paretic Leg Contribution in Hemiparetic Walking. Stroke. 2006; 37:872–877. https://doi.org/10.1161/01.STR.0000204063.75779.8d PMID: 16456121 ↩︎
-
Peterson CL, Cheng J, Kautz SA, Neptune RR. Leg extension is an important predictor of paretic leg propulsion in hemiparetic walking. Gait & Posture. 2010; 32(4):451–456. https://doi.org/10.1016/j.gaitpost.2010.06.014 ↩︎
-
Kramer PA, Sarton-Miller I. The energetics of human walking: Is Froude number (Fr) useful for meta- bolic comparisons? Gait & Posture. 2008; 27(2):209–215. https://doi.org/10.1016/j.gaitpost.2007.03.009 PMID: 17459708; Alexander R. The gaits of bipedal and quadrupedal animals. The International Journal of Robotics Research. 1984;. ↩︎
-
Pataky TC, Vanrenterghem J, Robinson MA. The probability of false positives in zero-dimensional analyses of one-dimensional kinematic, force and EMG trajectories. Journal of Biomechanics. 2016; 49 (9):1468–1476. https://doi.org/10.1016/j.jbiomech.2016.03.032 PMID: 27067363 ↩︎